Compare current construction flows and Ottawa’s September inventory by property type, alongside historical rent and building trends. Use the evidence to ask better buying and selling questions.
CURRENT EVIDENCE · 01
Starting a home is different from delivering one
12 months from September 2025 to August 2026 · all housing types · CMAs; Ottawa: Ontario part.
Vancouver and Calgary completed more homes than they started over this period. Montréal started more than it completed. These flows describe different stages of supply.
View exact data
Homes started and completed, September 2025–August 2026
CMA
Starts
Completions
Vancouver
26,078
29,026
Calgary
24,129
25,655
Edmonton
19,290
18,424
Montréal
28,818
24,453
Ottawa (Ontario part)
11,424
10,147
Toronto
25,593
25,416
Halifax
5,094
3,518
Starts and completions · number of homes
Green: startsCoral: completions
Vancouver
Started 26,078
Completed 29,026
Calgary
Started 24,129
Completed 25,655
Edmonton
Started 19,290
Completed 18,424
Montréal
Started 28,818
Completed 24,453
Ottawa (ON)
Started 11,424
Completed 10,147
Toronto
Started 25,593
Completed 25,416
Halifax
Started 5,094
Completed 3,518
Completions are not necessarily the homes started during these 12 months. Totals include rental and ownership housing; they are neither for-sale inventory nor a forecast of prices or delivery dates.
September 2026 · resale in OREB’s market area · months of inventory.
Apartments have 7.3 months of inventory versus 4.8 across the market. Buyers: compare your segment. Sellers: assess competing listings of the same type.
View exact data
Ottawa months of inventory, September 2026
Type
Months
All property types
4.8
Single-family homes
4.4
Townhouses
4.0
Apartments
7.3
Inventory at September’s sales pace · scale from 0 to 8 months
All property types4.8 months
Single-family homes4.4 months
Townhouses4.0 months
Apartments7.3 months
This ratio compares inventory with the month’s sales. It does not predict a property’s time to sell or a discount. National thresholds do not automatically classify these local segments.
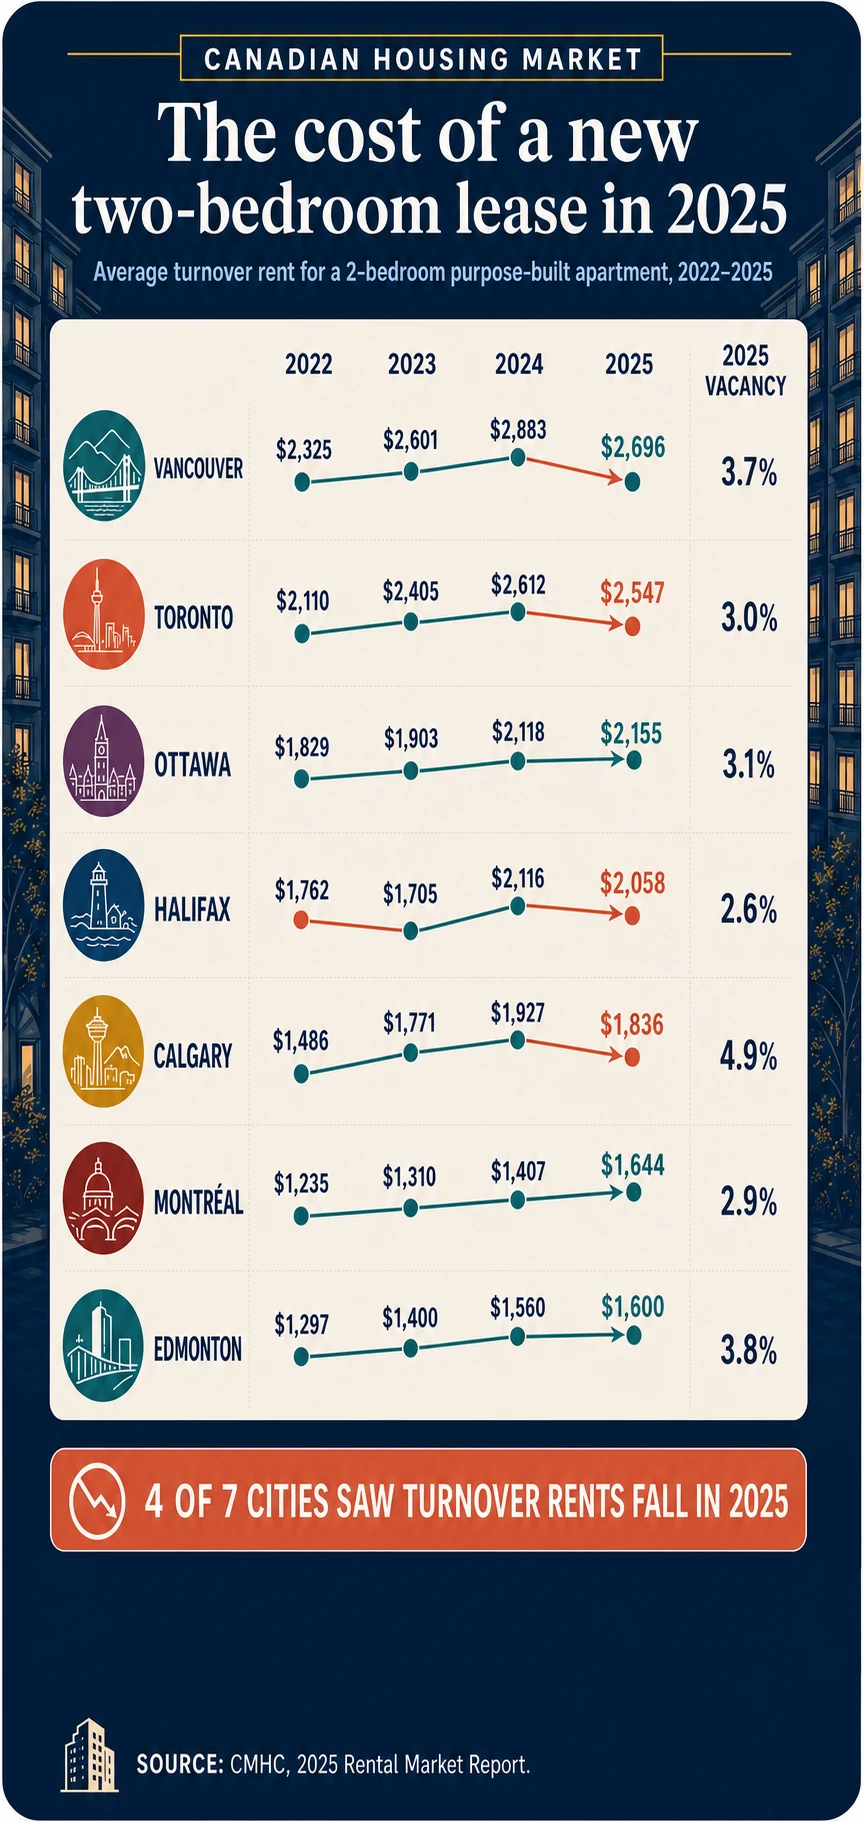
If you may rent between homes, compare the rent on newly available units, not only the average paid by all tenants.
In 2025, average two-bedroom turnover rent fell in 4 of the 7 tracked CMAs compared with 2024. These are purpose-built rentals, not all tenants’ rents or advertised asking rents.
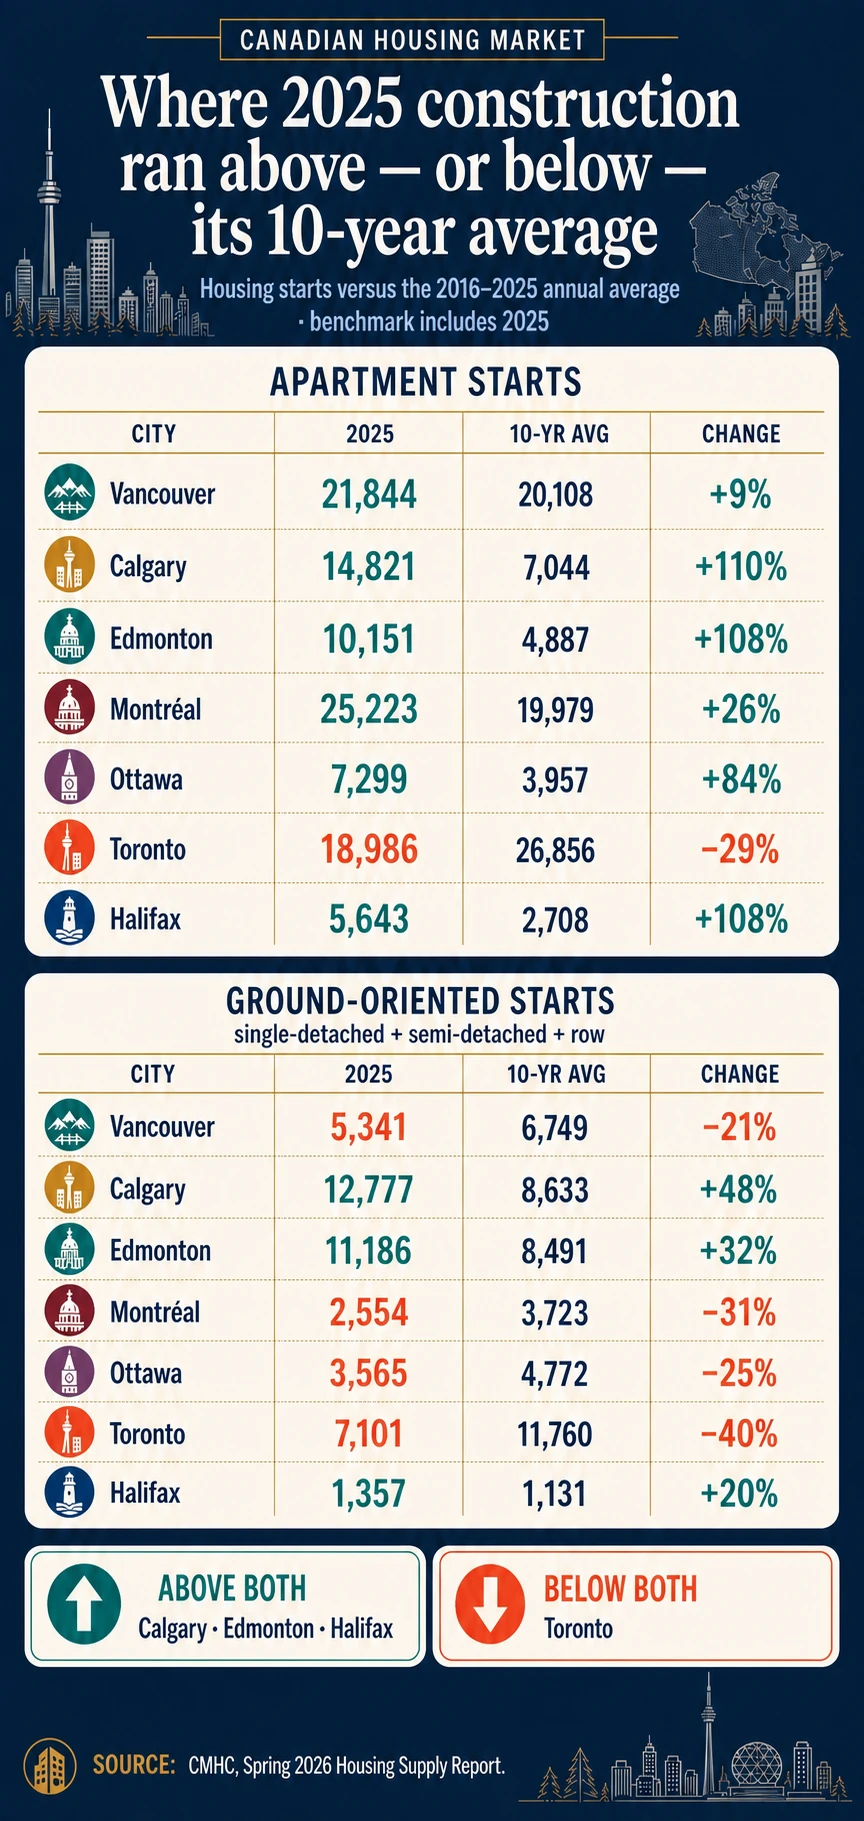
Compare each city with its own 10-year norm to separate a local building surge from a large city simply building more homes.
In 2025, Calgary’s apartment starts were 110% above its 2016–2025 average, while Toronto was 29% below its own. Each comparison uses that CMA’s own baseline, not a ranking of raw construction volumes.
View exact data
The same building boom is not happening everywhere
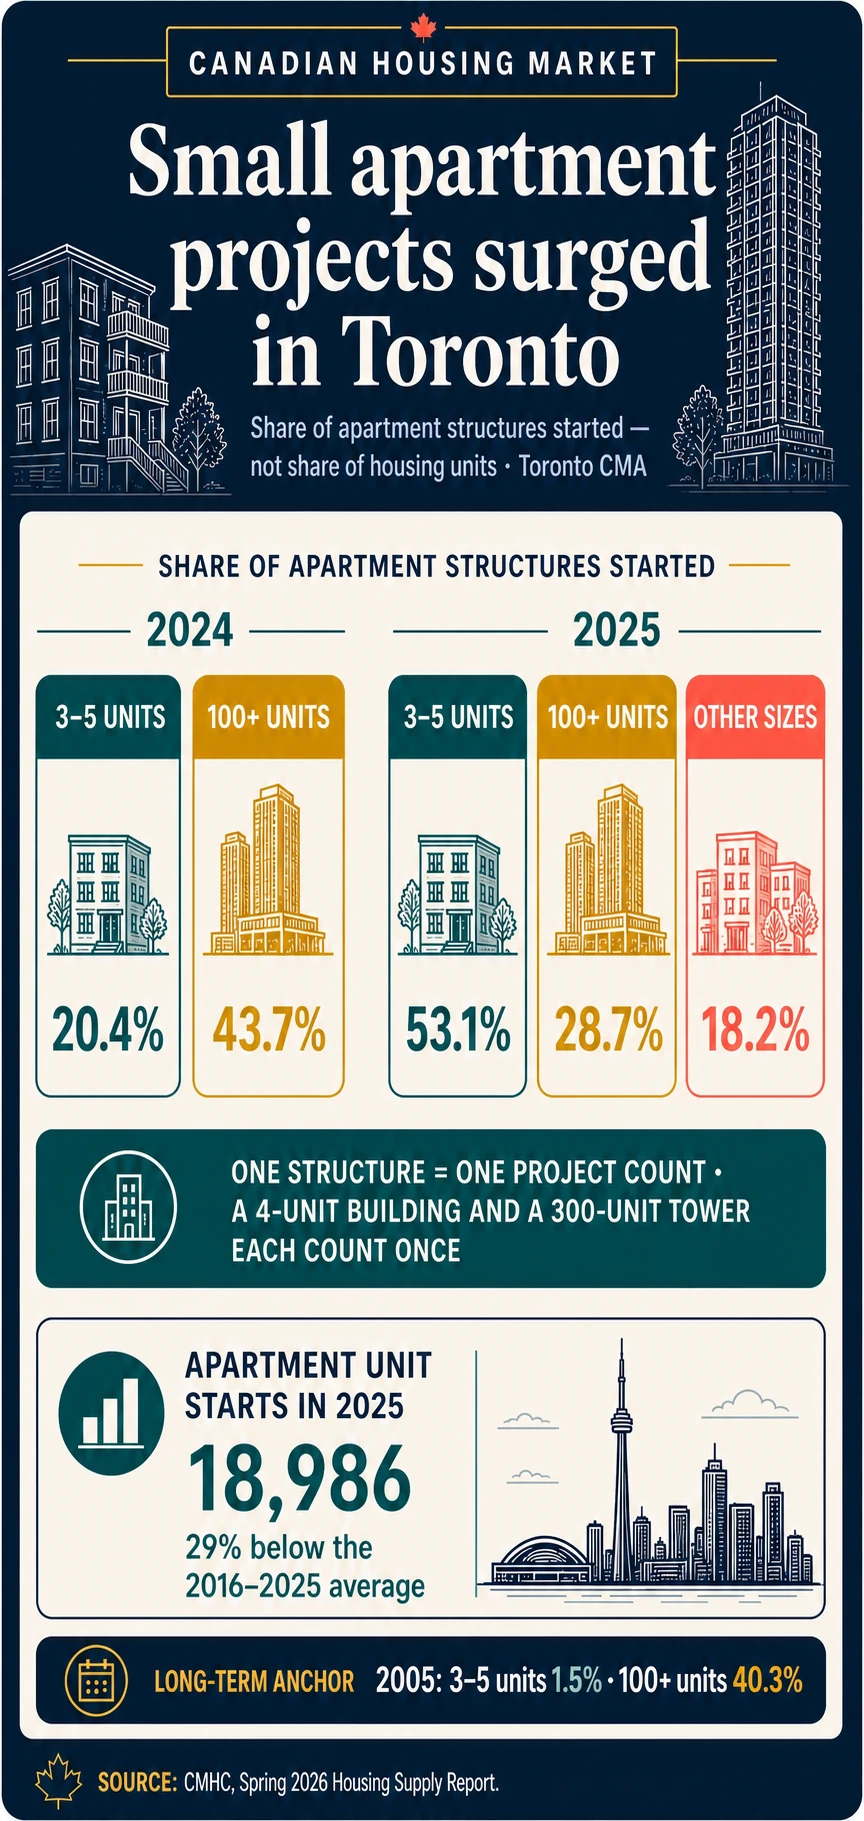
A four-unit building and a 300-unit tower each count as one structure. Check unit starts and completions before judging future supply.
In Toronto, the share of apartment structures with 3–5 units rose from 20.4% in 2024 to 53.1% in 2025; the share with 100+ units fell from 43.7% to 28.7%. These shares count structures, not dwelling units.
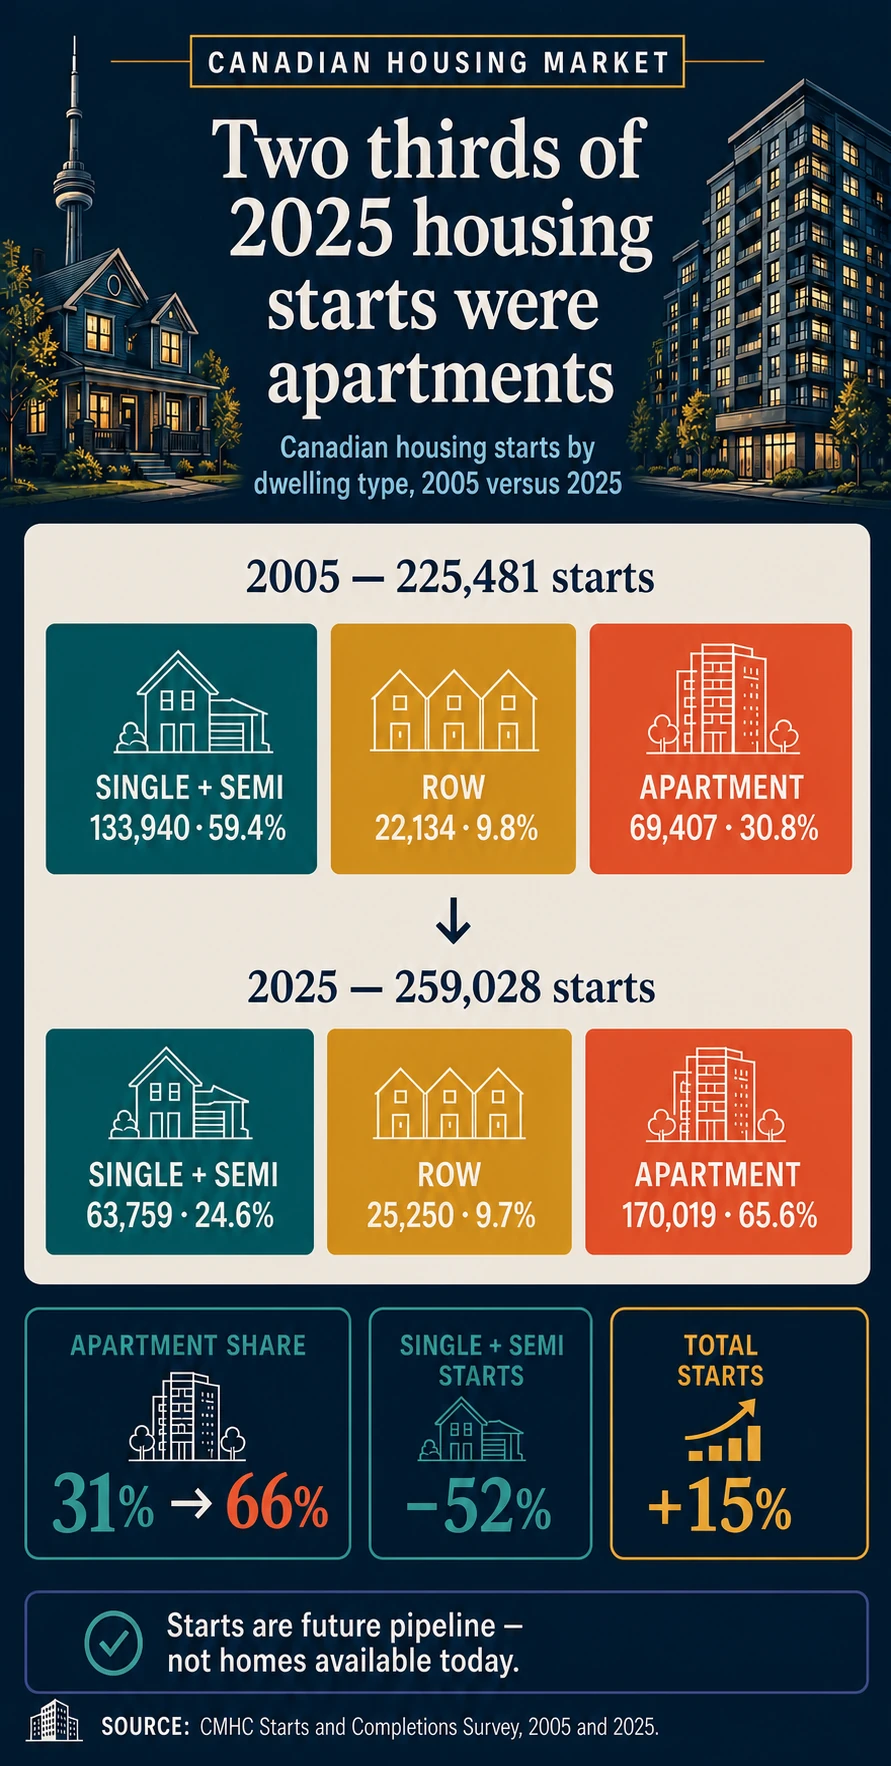
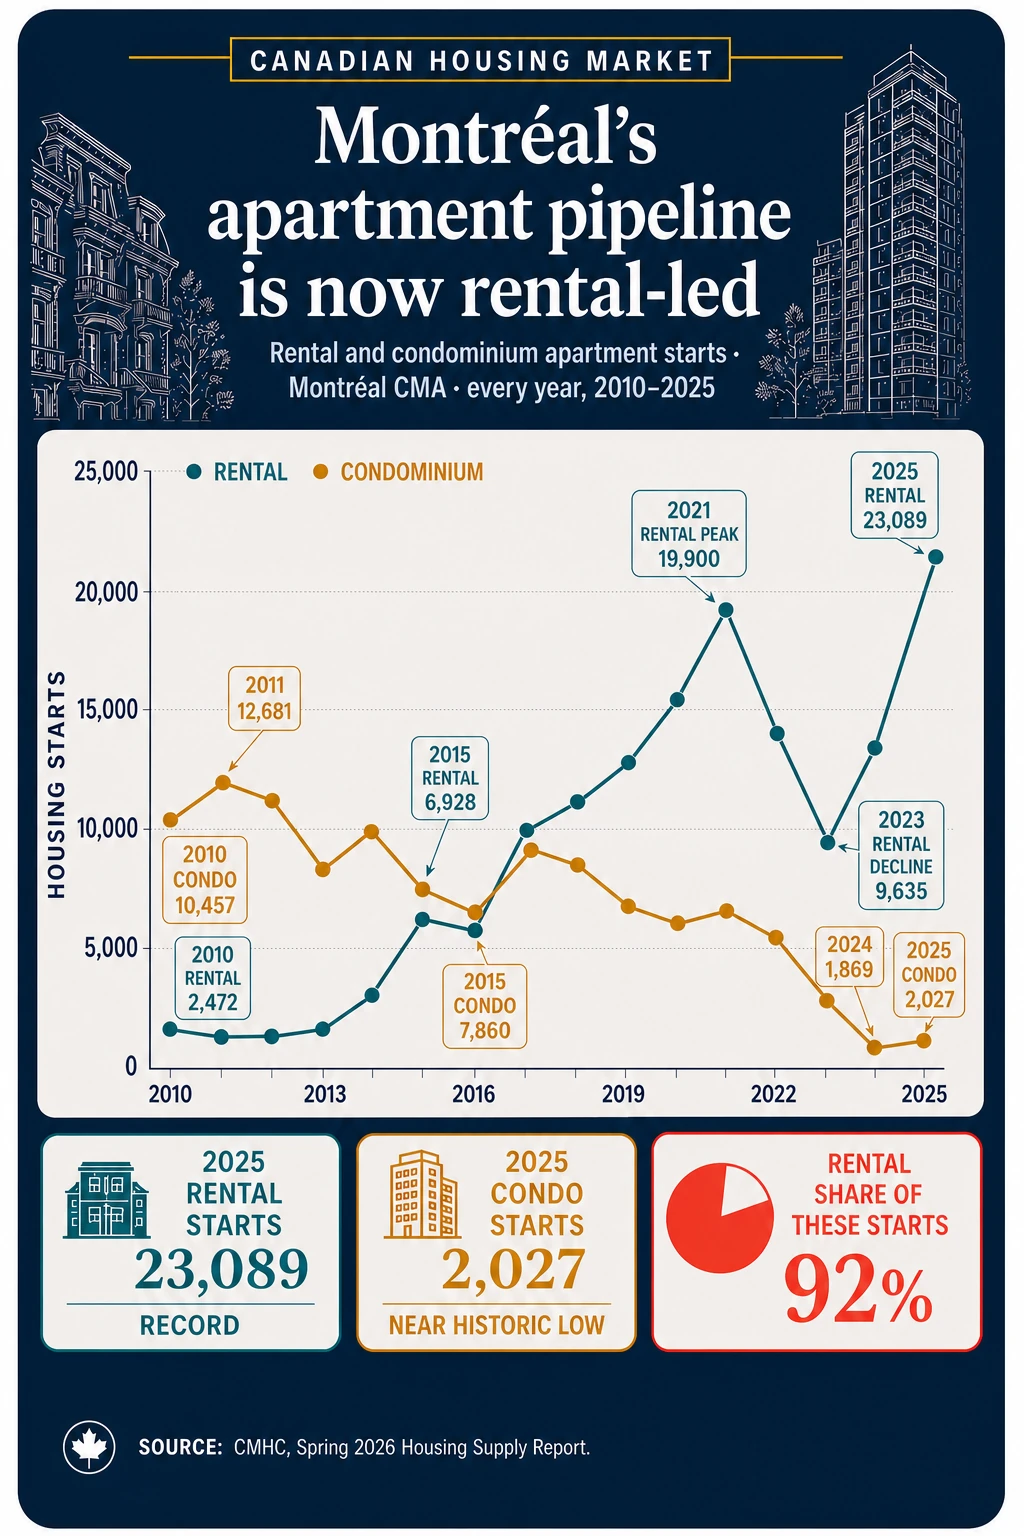
Rental construction can add future rental competition without creating equivalent resale-condo supply.
Montréal rental apartment starts rose from 2,472 in 2010 to 23,089 in 2025; condominium starts fell from 10,457 to 2,027. Future supply differs by tenure, and starts do not guarantee completion.
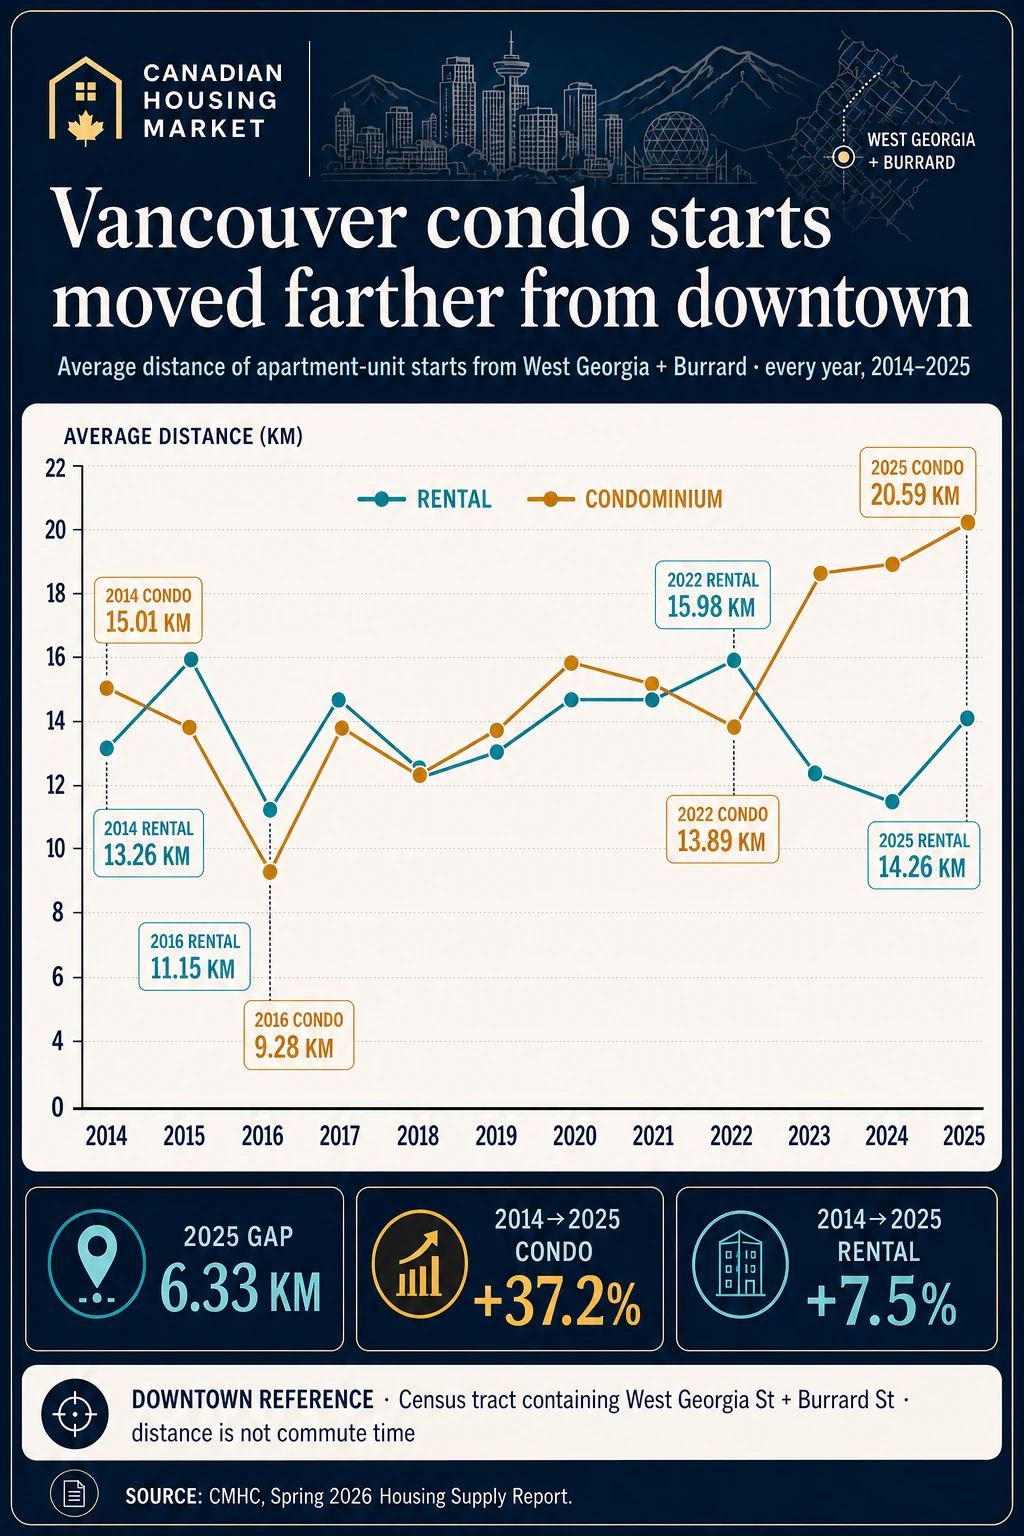
Use the regional pattern as context, then compare the exact project, transit access and neighbourhood.
In Vancouver CMA, condominium starts’ average distance from West Georgia and Burrard rose from 15.01 km in 2014 to 20.59 km in 2025. This regional pattern does not value a project or establish its accessibility.
View exact data
Vancouver condo starts moved farther from downtown
Vancouver condo starts moved farther from downtown
What is current, what remains historical
Verified October 6, 2026. National September resale and construction releases are scheduled for October 16; embedded observations remain August. Rents and the six posters above retain their explicit historical periods.
Open View exact data before any chart to compare the values and visit the official source. Metropolitan data describes a whole region; your neighbourhood or property can follow a different path.
Adapted from Canada Mortgage and Housing Corporation, Spring 2026 Housing Supply Report, 2025. This does not constitute an endorsement by Canada Mortgage and Housing Corporation of this product.Adapted from Canada Mortgage and Housing Corporation, Starts and Completions Survey and Rental Market Survey, August 2026 and 2025 reference periods. This does not constitute an endorsement by Canada Mortgage and Housing Corporation of this product.